Let’s talk about Production Data Tracking, and specifically problems that I’ve had over the years.
First, it is about math and numbers. Boring! Most people have a headache already just by reading these first three sentences of this article.
But, getting the data behind the actual work that is happening on your production floor is the secret to uncovering the truth on how to run your shop better. Data gives you proven tools to challenge the daily production results. Aspiration lives in those numbers. How can you get better?
It is a pain the butt to get that data though. (hint: until now)
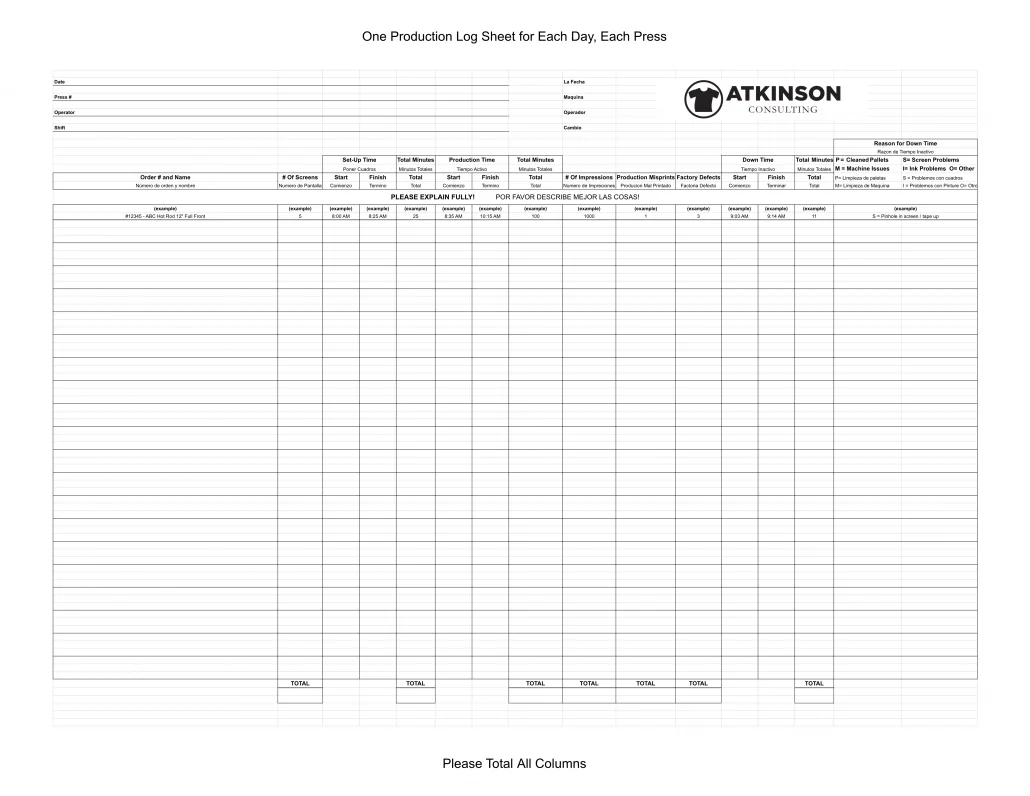
I’ve been championing paper production logs forever. Here’s the form that I built and have been using not only in the shops that I’ve managed, but with consulting clients, and even my ebooks too.
Paper Forms Not Needed Anymore for Production Data Tracking
Let me tell you the problem that I’ve had using paper forms.
First, they require the production manager to train the crew on how to fill out the form. And…insist on them using it. Legibility can be an issue. Getting the crew to handle the math can be a problem as well. Some people always need a calculator if you know what I mean. I’m including myself in that jibe by the way.
The other big problem is getting people to consistently fill out the forms. The goal is to get accurate data, so what happens when your crew makes up their numbers or fudges one way or another?
Next, you have to get that handwritten info into a spreadsheet and pivot table for it to make sense. Manually uploading that data is quite a chore. Believe me, I know.
Good news. These paper forms are not needed anymore for production data tracking. There is something better just around the corner!
The Secret Production Data Tracker Project
I’ve been working on an app. Yeah, I know. Me too. It seems like everyone has their own app these days.
Actually, I’ve partnered with a company from India called Grid. They already have production tracker software with over 5,000 users, and we’re modifying it to work for the decorated apparel industry.
Right now, as you read this, there are about two dozen shops in a few countries testing and giving us feedback.
Here’s How It Works
First, your shop will start a subscription-based account.
You can track production data for any decoration method in your shop. Screen printing. Embroidery. Heat Press. Digital Printing. Dye Sublimation. Laser Etching.
The app will work on any device. Apple or Android, it doesn’t matter.
In your account, you will set up a WorkGroup for each production machine that you want to track. The cost you pay is based on how many you are tracking.
Let’s take a look at how someone will use the Production Tracker app.
Daily Work Flow
Today, at Press 1, your press operator Bill clocks in and heads to his press. He starts the day by logging into the Production Tracker app and records the time that he starts working, which is 7:03 am.
From there, he starts getting ready for the day. Order 248745, which is a one-color left chest, three-color back on 288 pieces will be the first job for the day.
Bill enters the job information into the app and clicks Start Set-Up. Now, the app is recording how long it takes Bill to set up the left chest and get it ready to run.
But there is a problem. Bill discovers that there needs to be PMS 354 green ink mixed. He pulls up the app, and clicks Problem Start, and chooses Mix Ink on the pulldown. After the ink gets mixed, he clicks Problem End and finishes setting up. The production manager comes over and approves the job. Bill then clicks Set-Up Finish. Now he’s ready to rock and roll.
Except that he doesn’t start printing. He needs to use the restroom and on the way back talks about the basketball game that was on tv last night with Joe from shipping. A few minutes later he returns to the press.
Bill clicks Production Start and begins printing. 288 left chest pieces are a breeze to print and he’s finished quickly. He then sets up the back and knocks that out the same way, logging his information in the app as he works.
He runs the rest of the day just like that. Printing seven other jobs before he is through. At the end of the shift, Bill clicks End Day in the app to close out his shift. He clocks out and heads home.
Here’s a video of me using the app. I think you’ll get the picture on how easy it is to use after you watch this.
What Gets Tracked
Here’s the great thing about the app. Bill, or your other workers, only click the buttons on the app when they are doing something.
Because they start and stop the day, the app knows the total time they were actually working on that WorkGroup with value-add tasks. The Production Tracker app records the total time spent setting up, solving problems, and doing production. It gives you totals and averages on things like set up speed or run speed. It also lets you know the “Uptime” percentage, which is the actual time spent decorating shirts based on the amount of time the crew was working that day.
All of these totals are instantly fed into the cloud and graphed. You can set goals, and also graph other data points too.
In the graph above, there were two automatic screen presses recording the data for five business days and automatically graphed for comparison. Press 1 is blue and Press 2 is in red.
What will be great is that you can use a Smart TV or monitor and mount it on the wall and direct the URL for this graph to constantly show your crews their numbers as they work.
The horizontal dotted lines in the graphs are goals that you can set. Are they working above the goal or below it?
How You Can Get Signed Up
Well, to be honest, we’re still testing everything. Our goal is to have this out on the market around August.
There is a lot of excitement around the Production Tracker app, and this will have a bright future.
Want to be the first to know it’s ready? All you need to do is click the button below and get on the list.