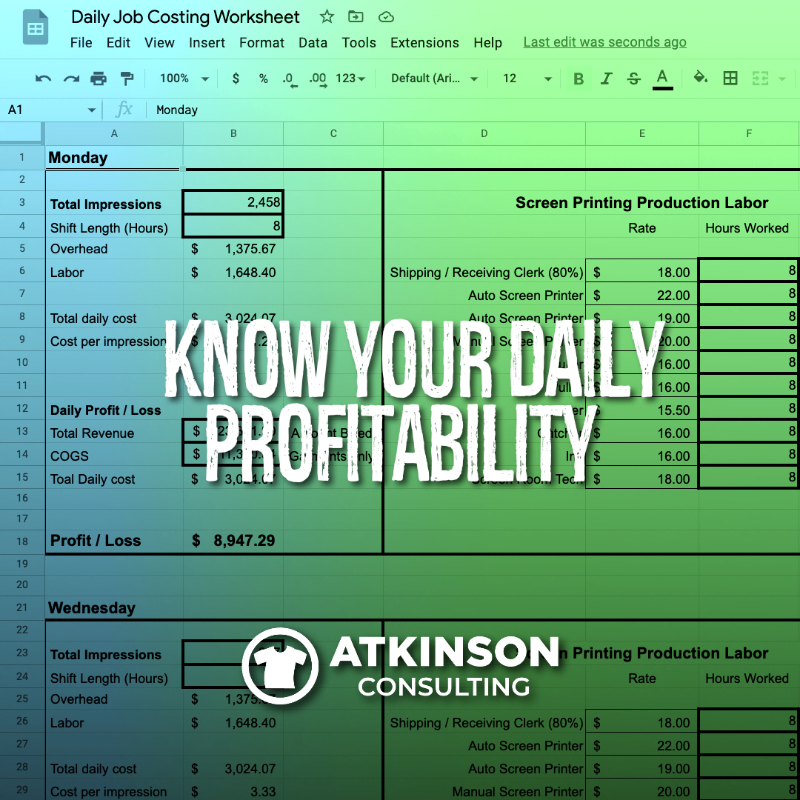
Do you know your approximate daily profitability? For most shops, the answer is no. It hasn’t been a priority. However, what if I told you there was a relatively easy way to calculate this?
One of my coaching clients, Jeff Barrette with Ink Factory Clothing in Claremount, New Hampshire, has developed an easy-to-use spreadsheet tool to get that daily profitability data. I’ve taken his method and made it generic so you can use it.
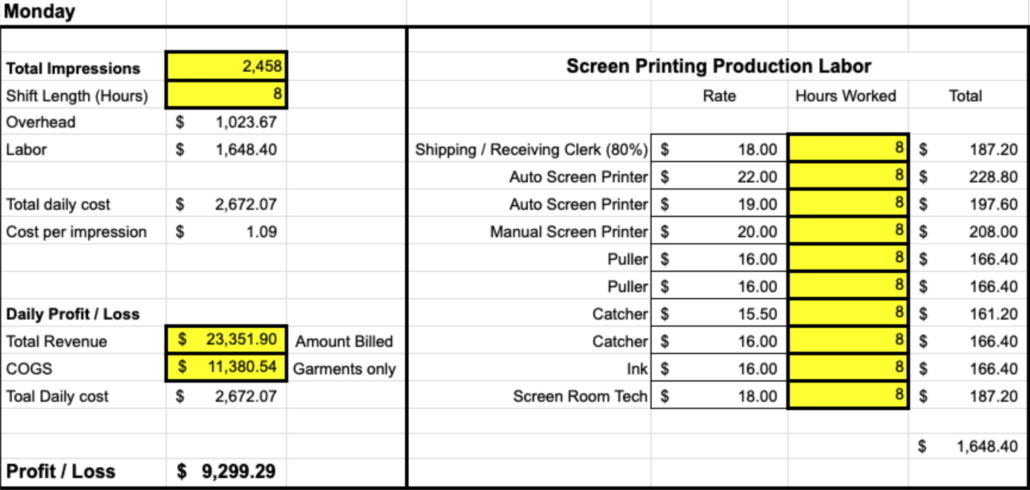
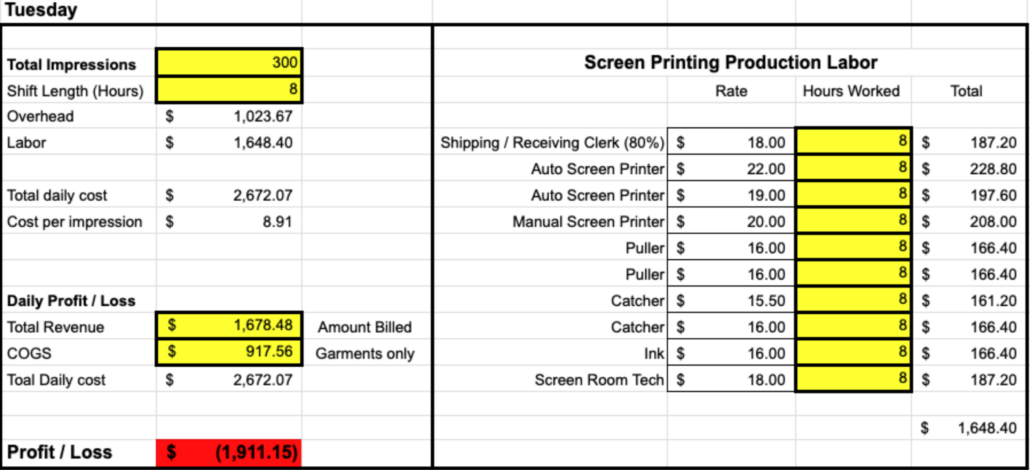
In fact, compare a profitable day with one that is more problematic:
The idea is simple. Grab your constant overhead values. Get your daily labor rate. Throw in the daily revenue total for what is being produced. Track the time it takes you to do the work. Shake and bake and determine if the day was profitable or not.
Compare the two charts above. This is example math, obviously; as you can plainly see, one day was a success, and the other was not.
Do you have similar challenges in your shop? For instance, one day the crew knocks it out of the park, but the next barely anything gets accomplished. What is that costing you?
Doesn’t that upset you? Here’s how you locate the data on what’s going on.
Watch the video below.
Let’s Break That Down
That video was just an overview. To get to the root of how to use this system, let’s break it down step by step.
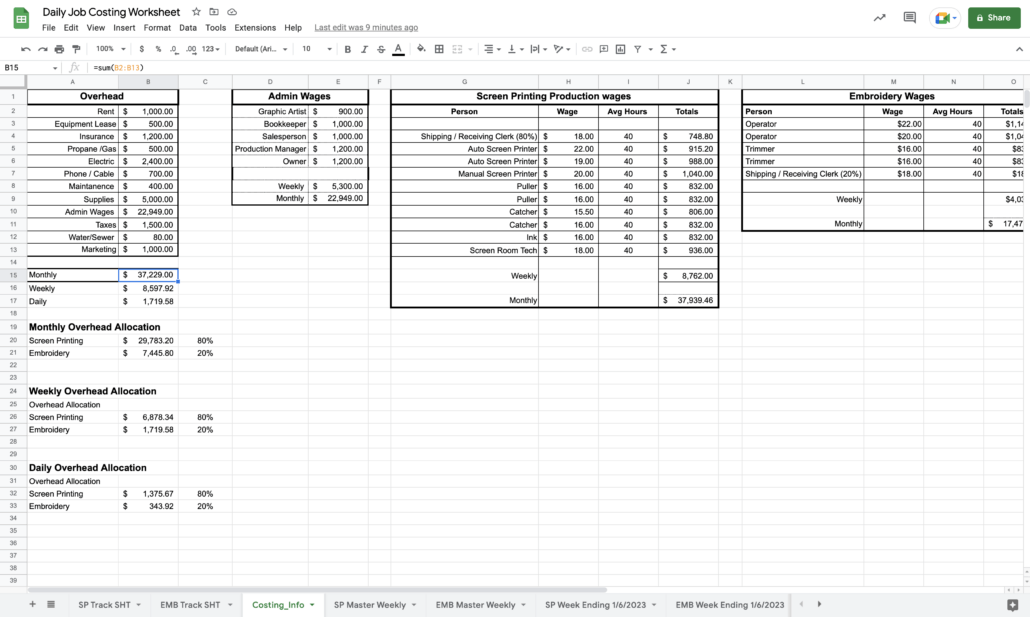
First, you will want to capture your overhead values in the “Costing Info” worksheet. Overhead is the money you spend to operate your business that isn’t tied into an order. These are standard costs that you pay constantly. Examples of overhead costs are rent or mortgage, insurance, equipment payments, marketing, your website, telephone, and any other fees or charges you frequently pay.
On the far left of the first spreadsheet is a simple list of the overhead amounts. Add yours in here. If something is not listed, add that to the list and include the amount. For your consumables, use an average spend per month.
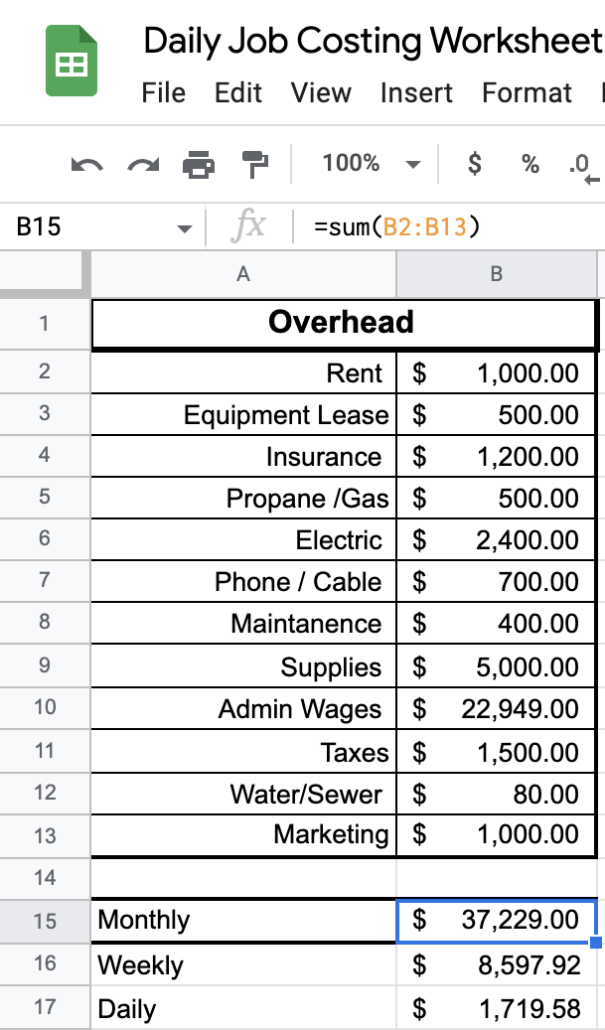
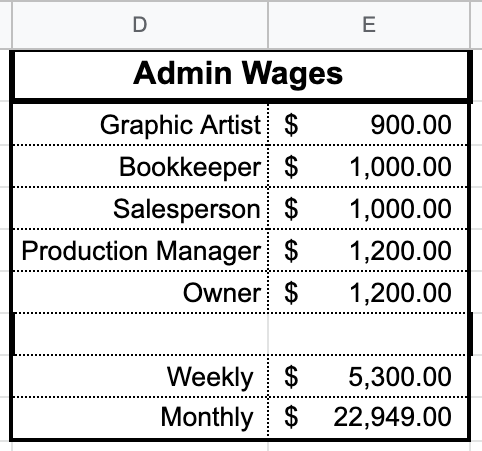
Subsequently, part of the overhead costing will also be your Admin wages. This is your non-production staff. This list includes your art department, sales, managers, accounting, and ownership payroll. Add in and list anyone that you feel needs to be here too.
Yes, You Can Include All Production Methods
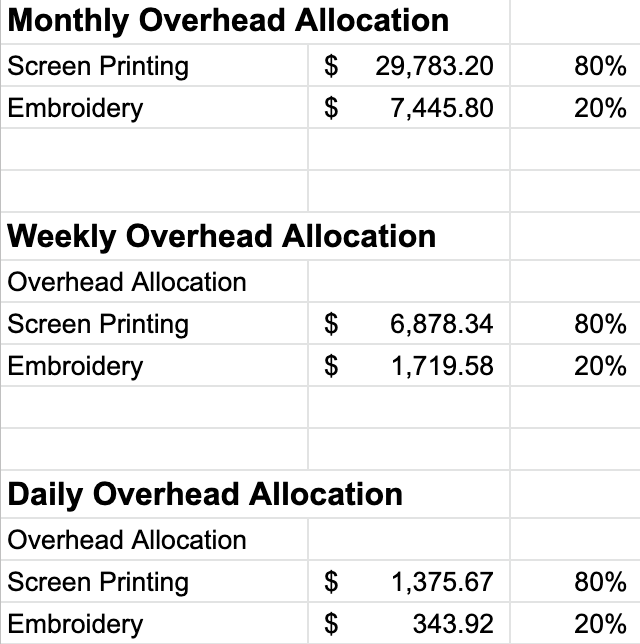
For simplicities sake, the article example includes only screenprinting and embroidery. You can add any decoration method or production department you want to track.
You will want to break out the costs by the percentage of the work you complete. In this example shop, 80% of the work is screenprinting, with 20% of the production load being embroidery. Yours absolutely will be different. Do your own math and enter the appropriate values for your shop.
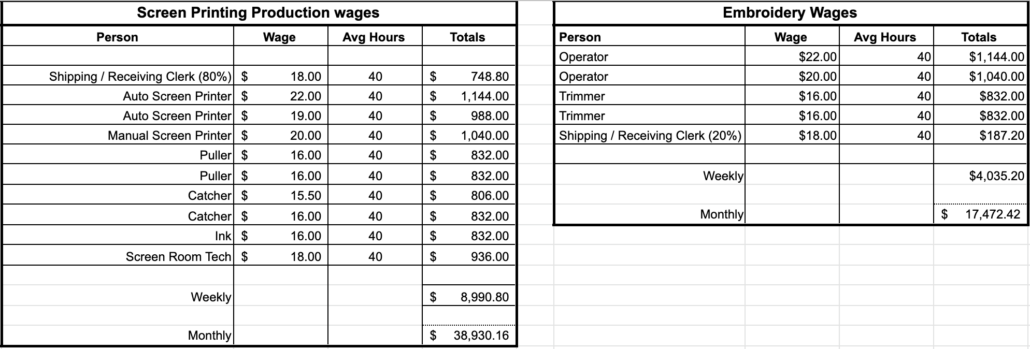
Next, Enter Your Production Labor Wages
One of the most important segments of this exercise is tracking your labor for your production crew. In the table, list and include each person’s rate. For ease, you may want to use their names. Here’s the generic version:
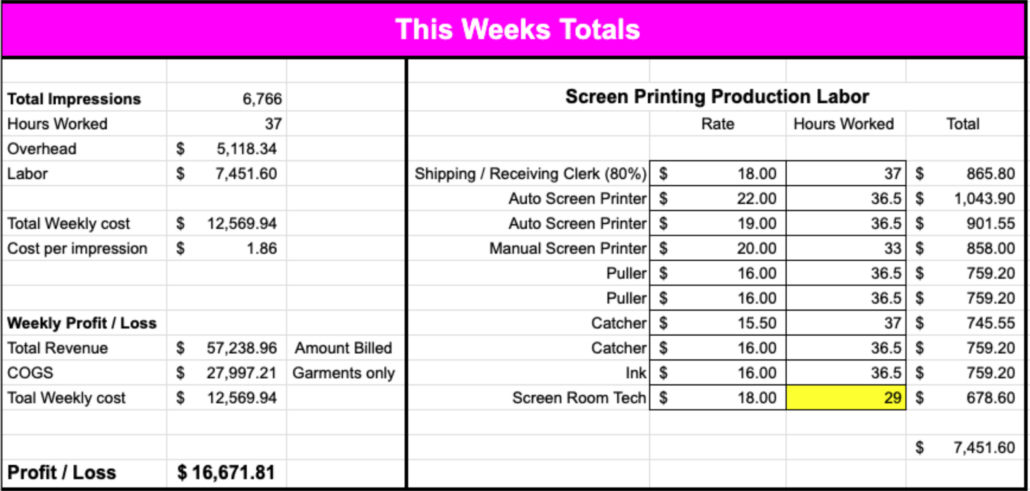
Weekly Profitability Tracking
Each week duplicate the Master Weekly worksheet and relabel it with the week-ending date. Obtain the daily values for these items and enter these into the appropriate daily cells.
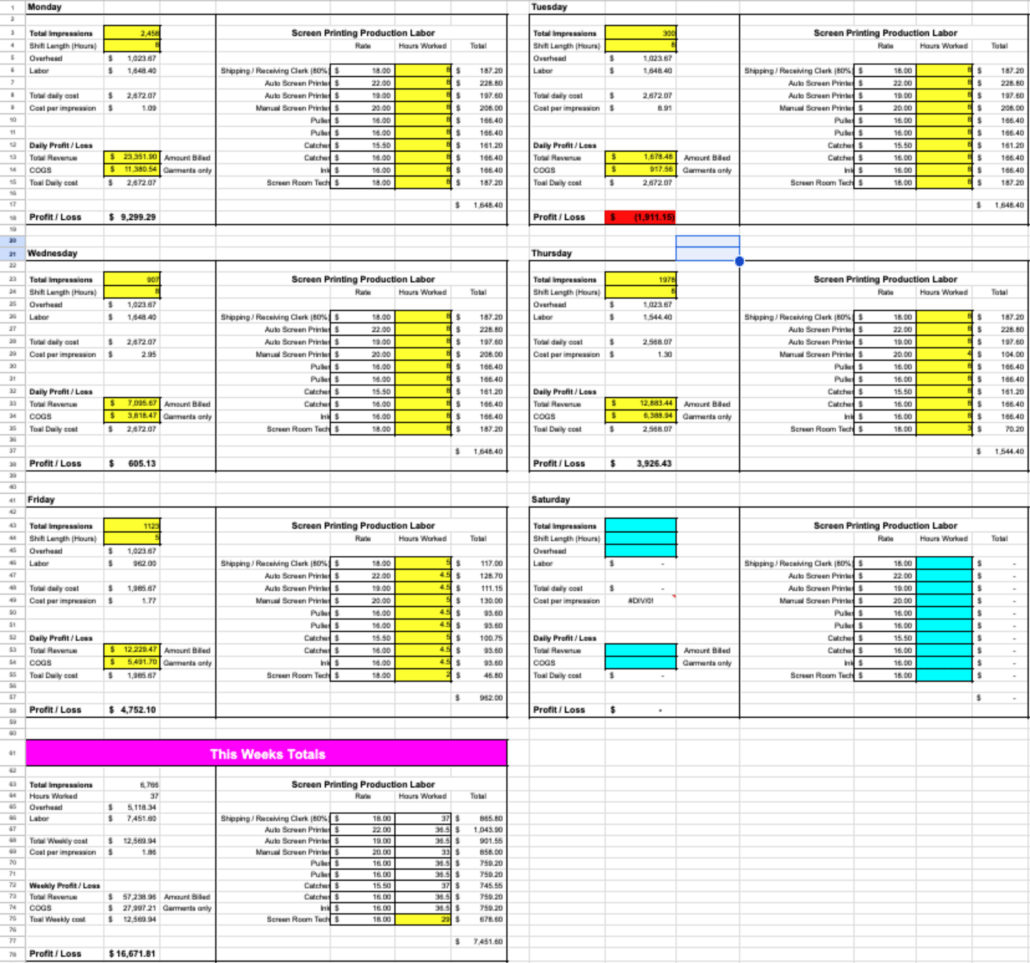
- Total Impressions – this is the total amount of work produced for the department. An impression is one decoration location. For example, a 100-piece job with a front and back imprint equal 200 impressions.
- Shift Length (hours) – this is the total amount of hours worked by the entire department. This will not necessarily be 8 hours, as you could work shorter or longer hours each day.
- Total Revenue – add all the order revenue totals for the completed production orders.
- COGS – This is garments only. Record what you spent on the items decorated.
- Hours Worked for each employee. Not all employees will be working the same hours. Don’t assume. Get the exact labor hours worked for each staff member and enter the total in the correct cell.
After you enter these five pieces of information, the spreadsheet does all the work for you. Unprofitable days will automatically have a red cell, as a conditional logic formula is set up already. Think of this as an alarm bell for you to start making changes.

Underneath the daily chart is a section that automatically totals everything so you can see the weekly profitability total. Note that a Saturday shift is included in the daily list, but it doesn’t automatically load.
You’ll need to add those for weeks with a Saturday shift.
Why This is Important
All too often, shop owners don’t have a way to easily visualize if they are on the right track to profitability. I can’t tell you the number of conversations I have where the shop owner doesn’t know if they are making any money. Everyone wants to get to the “next level,” but they don’t even understand what level they are on now.
Is this spreadsheet tool exact profitability or accounting?
No. It is a simple dashboard that can tell you if you are headed in the right direction. Think of it as a quick snapshot of your money before you get the P&L statements generated. Your accountant or bookkeeper will have more accurate information. This tool is useful because it is more of an immediate speedometer for profit.
Let’s say that too many of your days have red, unprofitable numbers. This will give you an early warning to start doing something about it before you get too deep. Will Rogers famously said, “The first thing you do if you find yourself in a hole is quit digging.” This dashboard system helps you with that and replaces that shovel with a ladder.
Try it and see what you think. If it proves to be worthwhile and effective, let me know.
“Working with limited resources is an excellent way to hone skills that will serve you well for the rest of your career. You will prioritize profitability from the start.” – Jon Oringer
“Profit in business comes from repeat customers, customers that boast about your project or service, and that brings friends with them.” – W. Edwards Deming
“The successful man will profit from his mistakes and try again in a different way.” – Dale Carnegie
Help Support This Blog

If you are reading this and it is not on my website, it has been stolen without my permission. Please report this to me, and/or publicly out the website that hijacked it. And if you are trying to copy and use it without my permission, you are stealing.
If you like this blog and would like to support it, you can:
- Buy a book.
- Share this blog on your social media.
- Join Shirt Lab Tribe.
- Subscribe to the Success Stories podcast.
- Watch and like an episode on the Jerzees Adventures in Apparel Decorating YouTube series.
- Get signed up for the new Production Tracker app.
Also, my basic elevator pitch to you is I’m that help with “Clarifying effective change.” Please schedule a discovery call here if you need help and want to learn more.
Thanks!

Marshall Atkinson also shares exclusive blog content at Supacolor.com. Supacolor makes The World’s Best Heat Transfer and provides tips, inspiration, and other resources designed to empower professional garment printers.